

Energy Consumption & Monitoring
Track energy consumption, production costs, and more


Smart Dashboard’s energy monitoring dashboard answers several key questions for managing energy consumption and production:
- How much energy is consumed?
- Who is using it?
- Which energy sources are being used?
- How much does it cost to produce?
View Detailed Breakdowns of Energy Use and Costs
This information is crucial because it not only provides a broad overview of energy demand but also displays more detailed breakdowns of energy consumption and cost numbers. With this data, we can answer big-picture questions regarding energy costs. However, we can also zero in on more specific questions that may arise.
For example, we can easily see the overall energy use and production cost numbers for any given date or date range using the date selection filter. Further, with the “Monthly Energy Consumption” and “Monthly Production Costs” widgets, we can see monthly breakdowns of these numbers.
Also, we are able to see the energy use numbers for different economic sectors, and the “Production Quantity” widget offers a breakdown of the different types of energy sources that are used by each industry. This data provides insight into larger questions, such as which industries use renewable energy most efficiently or which industries rely most heavily on fossil fuels.
View Energy Costs and Demands for Each Economic Sector
Finally, with the “Monthly Production Costs” widget, we can see a color-coded breakdown of each month’s costs by energy source. We can see exactly how much of each month’s costs resulted from each energy source, which illustrates how heavily we rely on different sources and how much they cost.
This dashboard thus offers valuable insight into not only overall production costs but also the costs required to produce specific types of energy. Moreover, with the industry-specific data provided by the “Avg Energy Consumption by Sector” and “Production Quantity” widgets, we can review the energy demands of different economic sectors and determine how heavily each sector relies on various energy sources.
Access live 30-minute demo with our experts
Energy Dashboard Examples

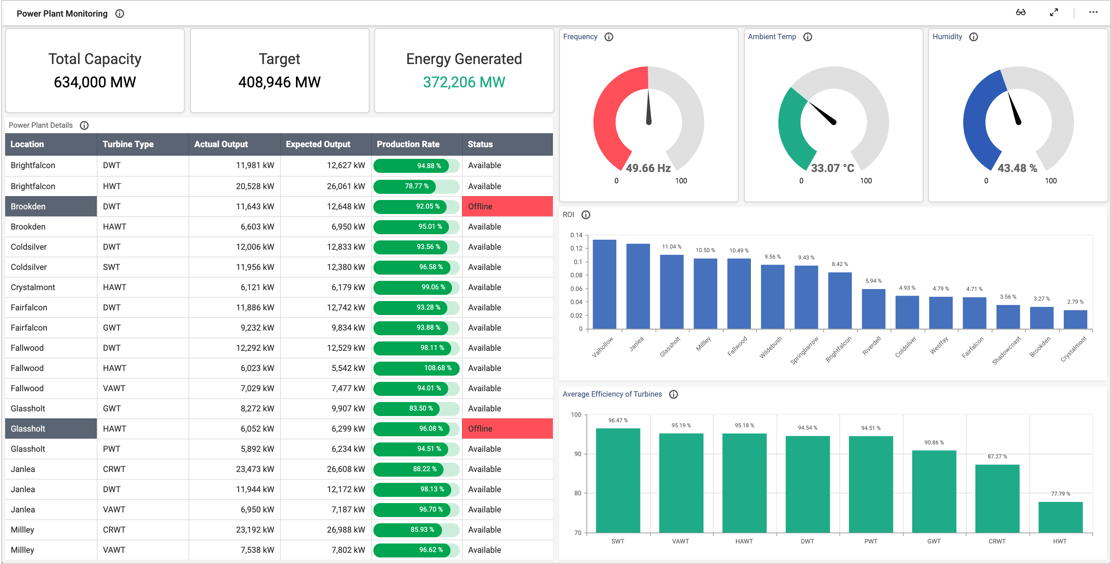
Smart Dashboard’s sample power plant monitoring dashboard displays the live production data of a series of power plants. This information is crucial as it…

